

The time inevitably comes for any Aptify developer where they run into some sort of inconsistent or undesirable behavior. The question then becomes: “is this a bug in a customization, or is this a bug in the core product?” Of course, one way to figure this out is to turn to a baseline instance of Aptify, repeat the same set of steps, and see if you get the same result.
While this is certainly a reasonable approach to the problem, is comes with drawbacks. For example, what if uncovering the exact issue led to the discovery that there was a workaround? You also are forced into keeping a baseline instance around all the time, or restoring a baseline instance whenever an issue pops up, which can be a time consuming process.
Let’s stop for a moment and think about how we would approach this problem if we were dealing with our own application, or even a customization inside Aptify. In that case, we’d likely begin some sort of debugging exercise, either using the debugging features of an IDE like Visual Studio, or perhaps more primitively by littering our code with logs out to the console.
We have the luxury of these methods because, of course, we have the underlying source code. Clearly, we aren’t going to just be handed the sources of a commercial product like Aptify.
The .NET Strategy
Microsoft had very ambitious goals when they undertook the design of the .NET Framework in the 1990s: write code once that could run across many different devices and platforms, using one of several different languages (VB.NET to get a large audience of classic Visual Basic and even some VBA developers; and C# as effectively a clone of Java, which clearly was the source of at least a good amount of the .NET strategy to begin with).
I could write endlessly about the fascinating journey of .NET and its creations (ie, Unity scripting, Xamarin), but for our purposes the most critical innovation in all this work was the Common Language Infrastructure (CLI).
A ISO and ECMA standard, the CLI defined code and a runtime environment for executing it. Higher level programming languages could be designed to target the CLI (C#/VB/F#), and the CLI itself could then be implemented across many different platforms (Windows and Xbox by Microsoft; *nix-systems by Mono).
You might be wondering what all of this has to do with debugging Aptify? As a consequence of this cross platform dream, CLI libraries and executables aren’t assembly code… they are a higher level representation that is run in a virtual machine. This means that without special work obfuscating the underlying CLI output, these built libraries actually contain within them a reasonable facsimile of the original source code.
Lost in Translation

So this sounds great… take a CLI library, throw it into a text editor, and you have the source code, right? If only it were that simple!
When source code is compiled, it’s turned into CLI, which as mentioned was designed for being interrupted by a VM, not for being read by a human being. What we need is a way to turn it back into something that is human readable.
This is a job for a decompiler! Several .NET decompilers exist to do exactly what we are after:
- JetBrains dotPeek (Free)
- Telerik JustDecompile (Free)
- Redgate .NET Reflector ($95)
Any of these tools will nicely decompile your assemblies, but my tool of choice for this job is dotPeek from the excellent folks at JetBrains (an article where I extol my love of ReSharper is likely coming in the future), so I’ll be referencing it exclusively throughout the remainder of this article.
Peekaboo
To begin exploring Aptify’s codebase, let’s disassemble our first Aptify assembly in dotPeek. There are a number of ways to approach this, but I find it convenient to be able to decompile assemblies straight from the file system.
This may not be enabled for you out of the box, but it’s a simple checkbox away inside the dotPeek Options window:
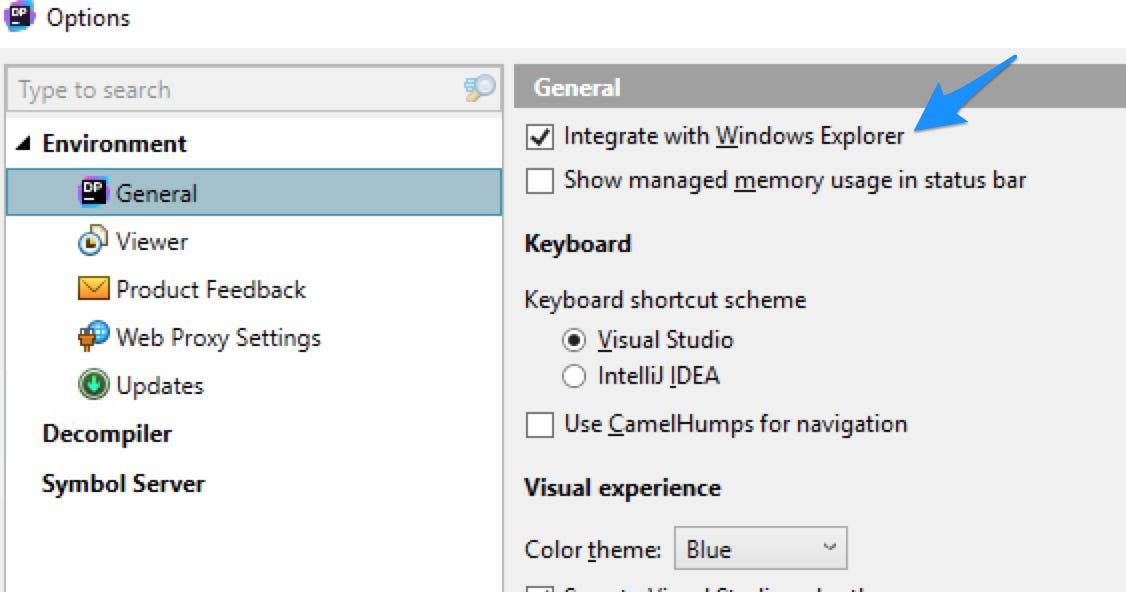
Once you have that enabled, you’ll find a new Browse with JetBrains dotPeek contextual menu item on class libraries and executables in Windows Explorer.

Now that we have an easy way to get these into dotPeek, let’s actually open our first Aptify assembly! Open up the Aptify folder in Program Files, and find the AptifyApplication.dll class library. Right click it, and select the Browse with dotPeek option. It will take a moment for dotPeek to launch and decompile the assembly, but once it finishes, you’ll find AptifyApplication in the Assembly Explorer.
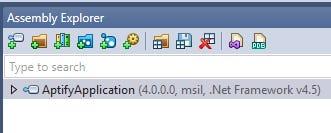
Our first assembly decompiled and ready to be explored!
Exploring AptifyApplication.dll
Now that we have the assembly loaded into dotPeek, we can start to explore its contents. To start, let’s use the tree view inside the Assembly Explorer to inspect the structures of the library.

Click the disclosure triangle next to the assembly name to see a top level overview of the objects within. You’ll find all the immediate references, some embedded resources, and under Aptify.Framework.Application, you’ll find a list of all the classes, structs, interfaces and enums this assembly defines.
To view the decompiled C# code for any of these constructs, just double click it. For example, find the AptifyApplication class in the list and double click it to open the code for this class. You can also click the disclosure triangle next to a construct to see the underlying structure of said construct (in the case of the AptifyApplication class, you’ll find various constructors, methods like DeleteEntityRecord, and properties like UserCredentials). Clicking these will take you straight to the relevant member.
dotPeek also has robust search functionality that makes it easy to jump to just about anything within an assembly. Pressing Ctrl+T will bring up the Search Everywhere floating window, which shows relevant search results as you type (this is also accessible from the Navigate menu if you’re more of a pointer fan).
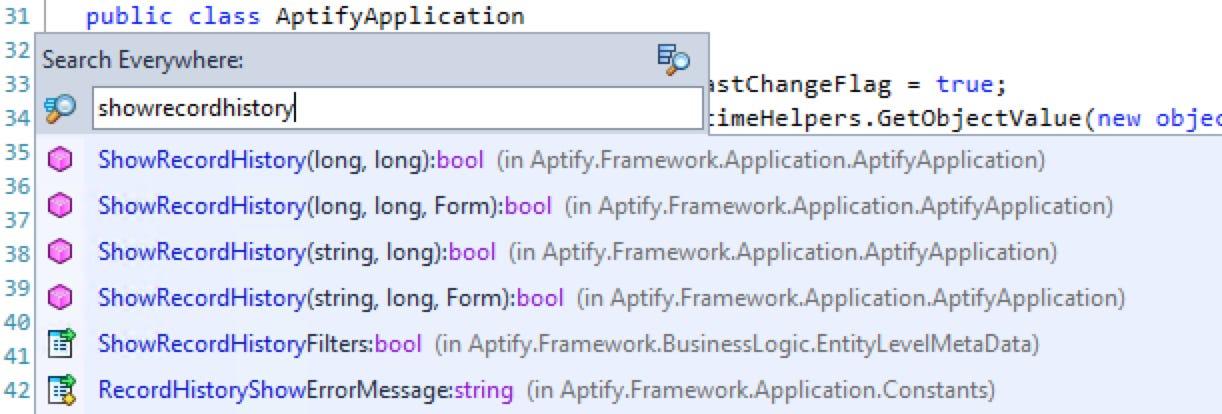
I can quickly jump to any of the overloads of ShowRecordHistory()
Imperfections
As you dig deeper into the Aptify sources, you’ll likely start to notice some things that are a little… odd. For example, going back to our good friend the AptifyApplication class, you’ll find the use of labels and the goto statement. While it’s possible these actually exist in the original Aptify sources, it’s likely they actually don’t (especially when you consider where you’ll find some of these in the code).
This is a result of a bit of fidelity being lost between the original source, the CLI representation, and the decompiled code generated by dotPeek. There can be several drivers behind this:
- There are different ways to take CLI code and convert it into readable C#. This is basically analogous to asking different scholars to translate the same book. Even thought the original text might not change, the translations that are sourced from it can be radically different (just ask any classic literature lover).
- If the assembly you have decompiled was built in release mode (which is typical here, since if we have an assembly built in debug mode, we should have the source at hand), you might be seeing changes that the compiler has made to the code to improve performance (for example, inlining).
- It’s possible the original source wasn’t C# at all, in which case the version you are inspecting isn’t even in the same language as the actual source!
- Some form of obfuscation has been used to attempt to make stealing or reverse engineering of the code more difficult. Since the virtual machine has to eventually interpret all the code, this simply acts as a deterrent, but it can still cause at least some bumps in the road and stop casual thievery. In the case of Aptify, older versions employed a rudimentary string obfuscation schema that was fairly easy to defeat. Recent versions have ended this practice, which I for one applaud (and you should too!).
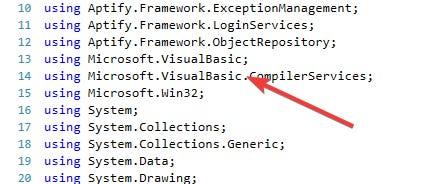
While it’s possible this class was ported from VB, it’s likely the origin source actually is VB.
Telescope to the Universe
So far, we’ve taken a look at a single Aptify assembly. While just being able to do this is an incredibly powerful tool for uncovering issues and discovering features that may not be well documented within the Aptify help documentation, it does raise a question: what if we are looking for something, and we don’t know exactly which assembly it exists within (for example, we know the name of a method from an Aptify exception). Aptify is built out of many libraries, and knowing exactly which library a particular method or variant of a method is defined within can sometimes feel a little like trying to find a needle in a haystack.
Luckily, dotPeek has us covered here too: not only can we load up a single assembly, we can point at an entire folder and dotPeek will crawl it and decompile all the CLI assemblies and executables within.

To do this, head back to dotPeek, and click the Explore Folder folder in the Assembly Explorer toolbar. Select the Aptify folder inside Program Files, click Select Folder, and wait a moment as dotPeek crawls the folder. Once dotPeek finishes crawling and loading metadata about all the assembles, you can use our old friend Search Everywhere to search across them all.
As an important note, since this loads in a large number of assemblies, you’ll want to be working on decent hardware with a good amount of RAM (if you want to see more details on dotPeek’s memory usage, you can check the Show Managed Memory checkbox in the Options dialog).
Another really neat feature is the ability to quickly view all usages of a particular construct. For example, if we use Search Everywhere to jump back to the AptifyApplication class, we can right click on the class name and select Find Usages to get a list of of all usages across all the assemblies (which for our Aptify install is over 1,800 usages!).
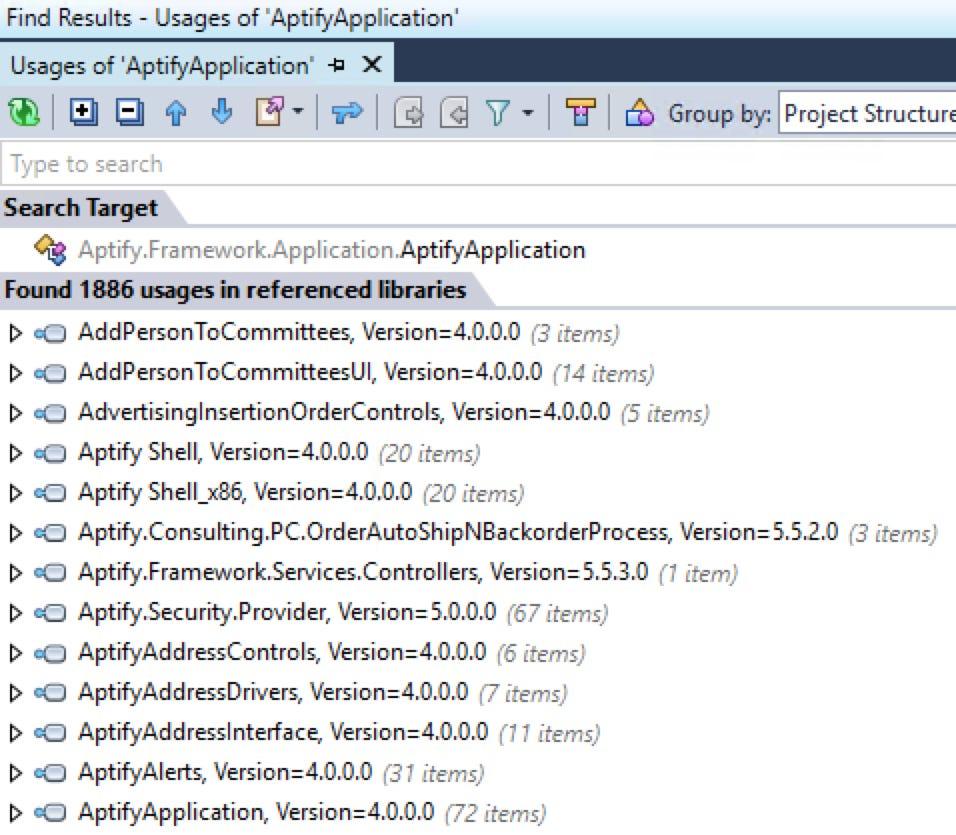
AptifyApplication is a very widely used class (no surprises there!)
What About Debugging!
The title of this article clearly has the word debugging in big bold letters, but thus far, we haven’t discussed how to actually do debugging. While looking over Aptify code can be incredibly useful for discovering both bugs and undocumented features, what we really want is to be able to do is the typical debug workflow: set a breakpoint, step through code, watch variables… you know, the whole kit and caboodle!
dotPeek ships with a Symbol Server that, when tied with Visual Studio, gives us exactly what we are after. There are a few things we need to do to get dotPeek and Visual Studio talking to each other, and we also need to adjust a few general settings in VS.
To begin, we need to make sure the Symbol Server is enabled and running in dotPeek. First, open the Options dialog and select the Symbol Server section from the sidebar. Make sure All assemblies is selected from the radio list. Since we are here, let’s copy the Server address to the clipboard by using the copy to clipboard link (you’ll also want to change the port if there are any conflicts with existing local services… for me, the default provided value wasn’t in use). Lastly in dotPeek, make sure to start the Symbol Server by clicking Tools > Start Symbol Server from the dotPeek menus.

Now, let’s make some changes in Visual Studio to get it working with the server.
First, we need to add the Symbol Server into the list of locations that Visual Studio will query for debug symbols. Keen observers will actually find the instructions for this right above the dotPeek Server URL we just copied. In case you missed it, open Options in VS and select Debugging > Symbols from the sidebar menu. Then click the green plus icon and paste the server URL.

By default, Visual Studio will only debug code that you have open inside VS. This feature is called “Just My Code”, and we’ll want to turn that off so we can debug code we don’t have… you’ll find this option under the General section of Debugging.

Now we are ready to start debugging Aptify internals! From a fresh VS instance, go to the Debug menu and select Attach To Process… (or type Ctrl+Alt+P). From this dialog, I’ll attach to the Aptify Shell.exe process I already have running (I could also attach to an IIS web worker process running the SOA or e-business). Once you attach, you’ll need to wait for a bit as VS runs through each of the loaded libraries in the process and attempts to download symbols for them. You can watch the progress of these operations in dotPeek by referring to the Project/Pdb Generation Status window.

Once symbol loading is complete, we just need to set a breakpoint. We can set a Function Breakpoint by typing Ctrl+B. Type the name of a function you are interested in breaking on, and then you should find that as you use the process you attached into, you will be dropped into decompiled code. From here, the sky really is the limit: step into functions, inspect and watch variable values, and even get performance and timing details!
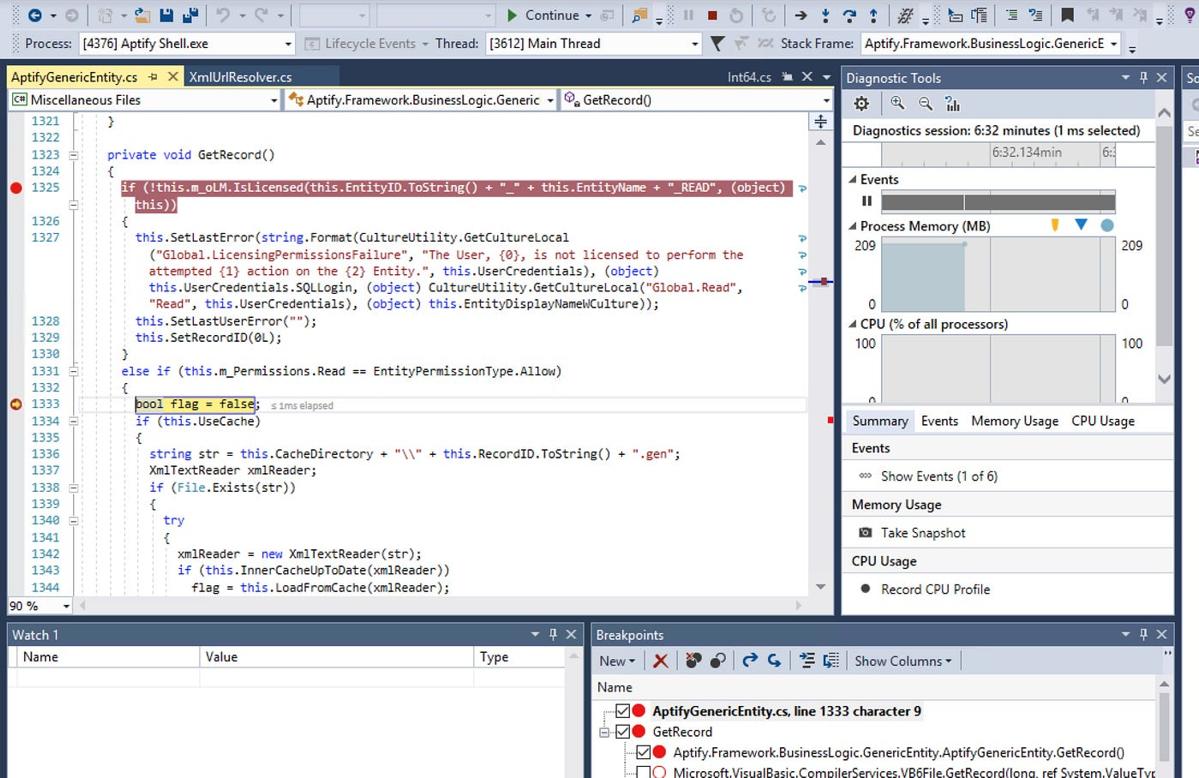
Here, I’ve added a function breakpoint for “GetRecord”, and opened a web user record.
Go Forth and Debug!
While documentation can be a great way to learn about a software product, I’ve learned over my career that nothing quite compares to actually digging into the internals and seeing the actual code. Documentation can sometimes be incomplete, out-of-date, or just plain wrong, but code never lies.
I can almost guarantee that spending some time exploring the Aptify internals will lead to all kinds of valuable insights into the product. As we’ve found, it can also be an invaluable way to discover bugs in Aptify (we’ve submitted several of these to Aptify that were the direct result of decompiling sources).
What are you waiting for: get out there and explore!